
Reusing Landlab ecohydrology model with bias corrected data from gridded hydrometeorology products.
In this work, we:
- downloaded hydrometeorology data for the state of New Mexico using OGH, a python package.
- binned the data based on elevation and analyzed spatial statistics
- downloaded meteorology data from weather stations in the area of interest
- bias corrected the binned data from gridded data products using observations from weather stations
- applied CATGrass model implemented in Landlab, similar to this, for each elevation bin
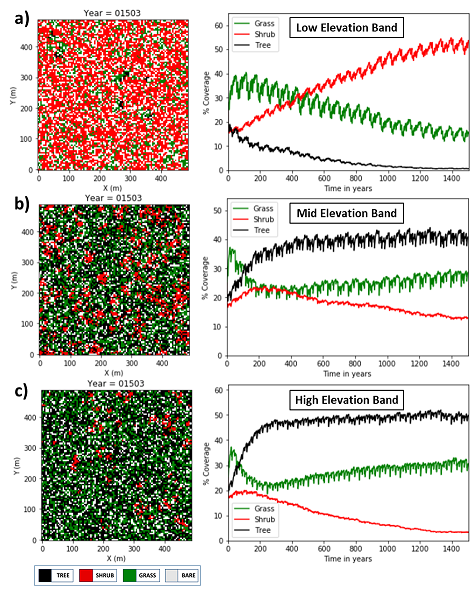
In the figure below, we show the ecosystem response at: (a) low elevation band; (b) mid elevation band; and (c) high elevation band. Drought-tolerant shrubs dominate low elevation areas. Trees dominate mid- and high-elevation areas as precipitation increases and temperature decreases. Grass occupy spaces opportunistically.
For more information, checkout this Jupyter notebook, and this publication.
*PFT - Plant Functional Type (Tree, Shrub, or Grass)